


.avif)

In 2025, LinkedIn has evolved into much more than a social media platform; it has become an indispensable growth marketing tool. An advertisement on LinkedIn can reach approximately 14.6% of the global population, which is more than a billion people. Moreover, LinkedIn Marketing Solutions crossed $5 billion in revenue some time back.
Such statistical evidence gives us irrefutable proof of LinkedIn's growing importance in a marketer's arsenal. So it's no wonder LinkedIn is the top channel for B2B marketers to distribute content.
However, with so many players already amassing the platform, how do you assess the success of your LinkedIn marketing strategy? The first step to gaining an overview regarding your growth rate and other KPIs on LinkedIn is to use LinkedIn analytics. Leveraging LinkedIn analytics helps you understand the efficacy of your strategy. Using them, you can monitor, evaluate, and refine your LinkedIn marketing approach to reach more people and drive revenue.
This LinkedIn analytics guide covers everything from what metrics to focus on to how to read and interpret the data.
What Is LinkedIn Analytics?
LinkedIn analytics signifies a collection of metrics that compile and present behind-the-scenes data of your company's LinkedIn activities. This includes critical criteria like your most targeted audience demographics, the degree and type of engagement your content generates, and the overall efficacy of your social media marketing approach.
For instance, LinkedIn analytics tells you about the number of visits you get on a particular ad, the number of people who liked or commented on it, or simply the number of clicks it generated. Businesses use LinkedIn analytics for the following reasons:
- Gaining Performance Insights: Gather insights into how your overall marketing strategy is performing on LinkedIn.
- Understanding Audiences: Attain valuable information on your audience demographics, such as their locations, industries, job titles, and more.
- Optimizing Content: Analyze key performance indicators like clicks, shares, and comments to identify the nature of content that receives the most engagement.
- Calculating ROI: Assess the impact of your activities, such as sponsored content or LinkedIn Ads, and make data-driven decisions to allocate resources effectively.
- Understanding Your Competition: Learn how your competitors are achieving success and incorporate positive practices into your own brand marketing.
How To Use LinkedIn Analytics
Two primary ways to get your LinkedIn analytics: using LinkedIn's in-built analytical tools and third-party tools. LinkedIn analytics provides the most basic metrics to gauge your campaign success. Use a third-party marketing automation tool to dive deep into particular metrics that require automation or have more in-depth insights. Let's examine each option more thoroughly.
Native LinkedIn Analytics Tool
All page administrators have access to the native analytics tool. Easy to use, it offers comprehensive and neatly presented insights into your page's performance. You can reach your LinkedIn dashboard in the following ways:
- Step 1: Navigate to your company page and select the "Analytics" tab on the left side of your screen.
- Step 2: Once you click the tab, a new page will appear with analytics for content, visitors, followers, leads, competitors, and employee advocacy.
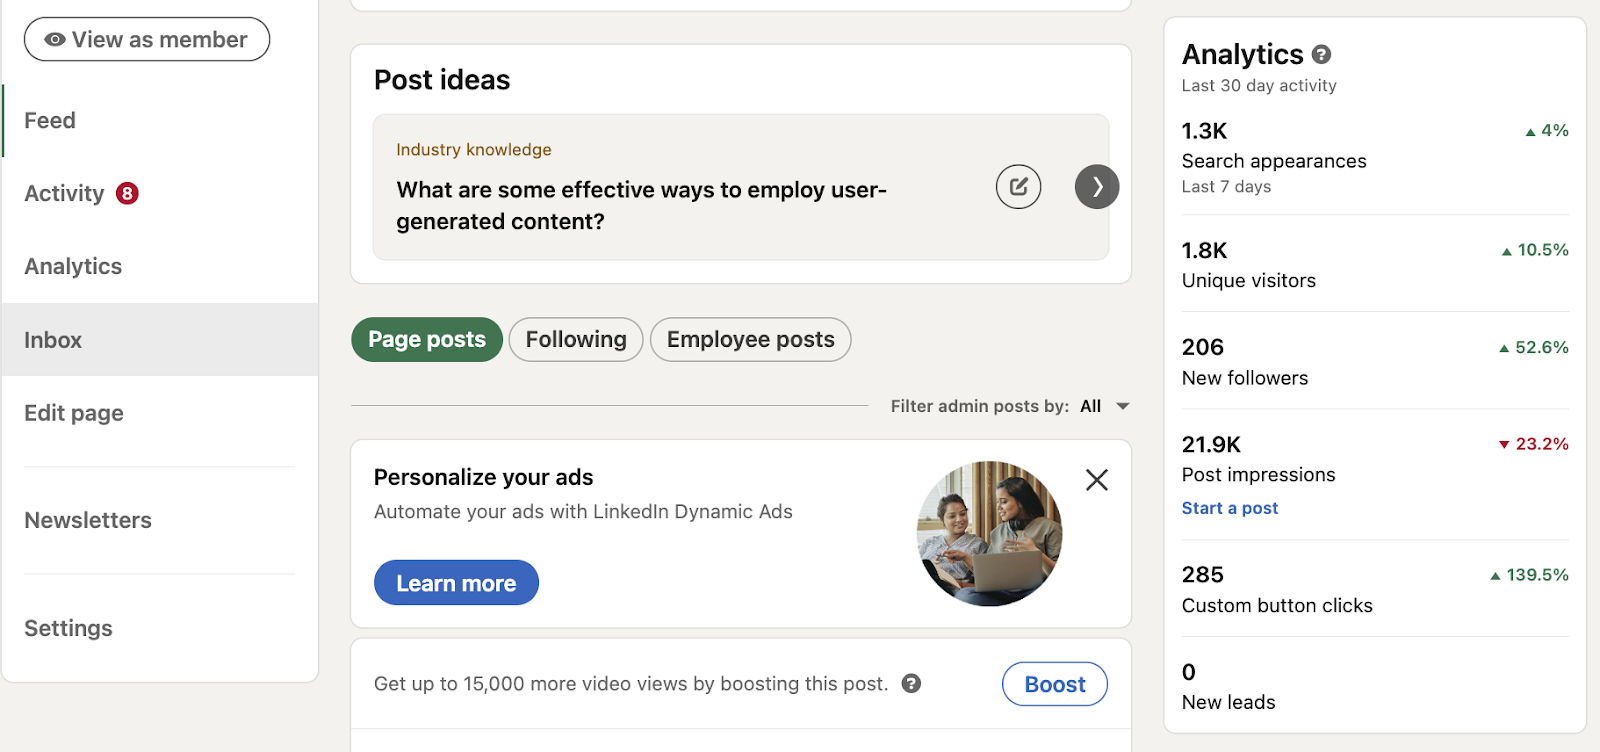
- Step 3: Additionally, you can locate a brief overview of your activity from the last 30 days on the right-hand side of your LinkedIn page feed.
Let's now take a closer look at the metrics available to you.
Content Analytics
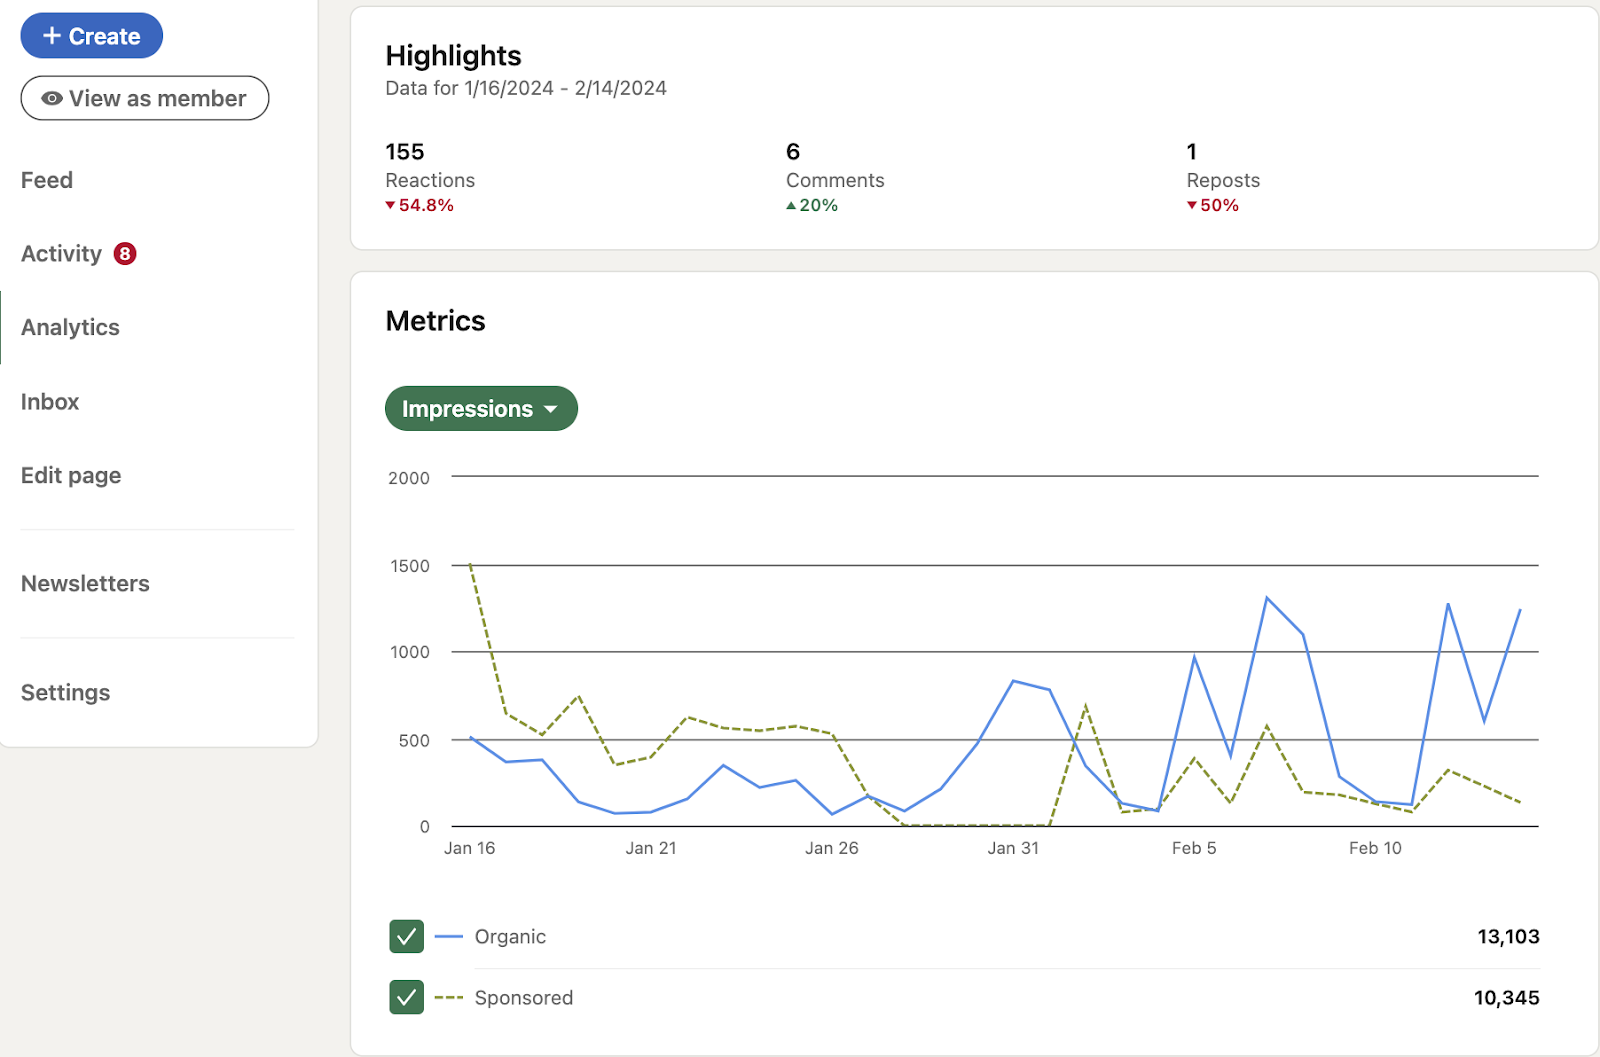
Content analytics summarizes how well your posts perform on LinkedIn. They display metrics such as reactions, comments, reposts, and overall audience engagement. You can visualize this crucial data through line graphs illustrating your content's performance trends over varying periods.
You can access specific information using LinkedIn post analytics to examine a particular part of your content. If you want to zero in on the metrics of a particular post, you can easily do that by clicking the "View analytics" button at the bottom right of a post.
Visitor Analytics
This section provides insights about people visiting your page who haven't yet become loyal followers. The visitor analytics will help you discover comprehensive details about your visitor demographics, encompassing their job function, seniority, industry, and company size.
This data allows you to identify traffic patterns and customize your LinkedIn updates accordingly to resonate with new visitors. It opens up new opportunities for conversions and heightened engagement rates.
There are several insights you gain insight on:
- Impressions: How many times were your posts viewed?
- Unique impressions: How many times have LinkedIn account holders viewed your posts?
- Clicks: Number of clicks on your posts or any brand touchpoint by LinkedIn account holders.
- Reactions: Number of reactions to your posts.
- Comments: Number of comments on your posts.
- Reposts: Number of reposts.
- Engagement Rate: The number of interactions, clicks, and gained followers divided by the number of impressions
- LinkedIn Profile Analytics: While we are on the subject of individual users, monitoring your own profile analytics is essential if you provide professional services through your LinkedIn profile or serve as a brand ambassador.
You can access these statistics on your profile, located directly under "Your Dashboard." It showcases all the KPIs mentioned above for your profile.
Follower Analytics
Your follower analytics encompasses the number of new followers gained and your total follower count. Additionally, you'll observe a geographic breakdown indicating where your followers reside. Use this data to identify emerging markets or reinforce campaigns in areas where you're already resonating. Mentioned below are some follower metrics.
- Job description: Useful for understanding the position in the company and to whom your marketing is appealing.
- Business Size: The larger the business, the more chances your marketing will be shared among more individuals.
- The Industry and Fields They Work in: This gives you information regarding which fields your followers are coming from and which industries you have the most or least outreach in.
- Their Seniority in the Industry: Their position in the industry lends to their authoritativeness and how valuable their words are to other professionals
Employ these insights to shape your strategy and produce content tailored to your most enthusiastic supporters. Towards the bottom of the page, you'll find a roster of all your current followers, including both individual users and companies.
Lead Analytics
If your LinkedIn page hosts a lead generation form, you can track leads and conversions. 89% of B2B marketers rely on LinkedIn for lead generation. Thus, you must analyze metrics such as conversion rate and cost per lead to assess the effectiveness of your campaigns.
Moreover, you can download your leads and evaluate the impact of your campaign by examining metrics such as completion rate, cost per lead, and more. This data enables you to discern what strategies are effective and which ones need improvement, thus enhancing your overall results.
Competitor Analytics
LinkedIn competitor analytics enables you to monitor and compare your page's performance against competitors. It allows you to identify the strengths and weaknesses in your marketing strategy.
A benchmarking feature allows you to compare your performance against your competitors. This option provides useful insights into how your LinkedIn presence measures up against others in your industry, enabling you to identify strengths, weaknesses, and areas for improvement.
You can set the following benchmarks:
- Growth in followers for a particular period
- Total engagement rate
- Post type by engagement
- Number of likes, reposts, and comments
You can also peruse trending competitor posts for more information on what works best in the contemporary market.
Employee Advocacy Analytics
These metrics assist LinkedIn page administrators and marketers in evaluating how employees interact with recommended content. Whether you hire long-term employees or make do with freelancers, the following metrics will prove helpful.
- Number of recommendations an employee receives
- Number of comments on posts made by employees
- Your engagement rate through the employee advocacy program
LinkedIn Hashtag Analytics
There is no dedicated LinkedIn hashtag analytics page. However, there is a way to circumvent that. Just follow these steps.
- Step 1: Navigate to your LinkedIn page and input the hashtag you wish to track into the search bar.
- Step 2: At this point, you can filter search results by posts, people, or companies that have utilized the hashtag.
You will now better understand the kind of engagement a specific topic or conversation receives on the platform.
LinkedIn Newsletter Analytics
A newsletter on LinkedIn consists of regularly released articles focused on a particular subject. By subscribing to a newsletter, you receive push, in-app, and email notifications whenever the author publishes new content. All LinkedIn users can discover, read, and share newsletters on the platform. That makes it an excellent way of generating organic followers.
LinkedIn's in-built analytics platform enables you to monitor the following metrics regarding your newsletters:
- Subscriber count
- Click-through rate
- Newsletter opening rate
- Number of subscribers and unsubscribers
The Best LinkedIn Metrics to Track
While LinkedIn offers marketers the opportunity to zoom in on many metrics, it doesn't mean each deserves the same kind of attention. Giving equal weight to all metrics may waste most of your work hours chasing irrelevant stats. That's why tracking metrics that align with your marketing objectives is important.
For instance, if you are focused on gaining new followers, focus on visitor and competitor analytics. This way, you inform yourself of the kind of audience you are cultivating while understanding what your rivals are doing to gain traction.
Content Metrics to Track
Irrespective of your marketing goals, here are some hand-picked vital indicators that are useful for tracking in diverse business settings.
1. Impressions
Impressions tell you how frequently your LinkedIn posts are displayed on a user's screen for at least 300 milliseconds. They help you understand your post's reach and can be used in conjunction with engagement to calculate your engagement rate.
While it is a helpful metric, unique impressions are often more valuable. They represent the number of times individuals with an active LinkedIn account view your post. The advantage is that instances where a user sees the same post multiple times are not counted.
2. Reactions, Comments, and Shares
These engagement metrics tally the number of reactions, comments, or shares your post has received - all crucial parts of your engagement rate.
LinkedIn Reactions offer various emotional responses to your content. Users can choose emojis to express admiration, joy, support, dissatisfaction, or curiosity about the content you share.
Shares represent each instance a user shares your content. This gives you info regarding how your post spreads and reaches out to other individuals and businesses.
Finally, the number of comments on a post signals a genuine interest among your audiences.
3. Clicks
A click measures the number of times a user with a LinkedIn account engages with your content. Reactions, comments, and shares are not counted under Clicks on LinkedIn.
4. Engagement Rate
The number of people who interact with your post against the total number of people who view it is a useful indicator of the overall result of your marketing efforts.
You can calculate your engagement rate by summarizing the number of interactions, clicks, and new followers acquired and dividing this total by the number of impressions the post receives.
Follower and Visitor Metrics to Track
Here are the most critical LinkedIn metrics to track for followers and visitors.
1. Follower Metrics
Follower analytics is all about people who love your brand. These metrics offer valuable data to improve both the total number of followers you have and the rate at which you gain followers.
- Follower Gain Rate: Illustrates the growth (or decline) in the number of followers your brand's page has experienced over a specific period.
- Total Number of Followers: The cumulative count of current followers your business page has amassed.
- Demographics of Followers: Provides insights into how your content resonates with followers across various industries, seniority levels, age groups, and geographical locations.
- Follower List Sorted by Total Engagement: Helps identify your most dedicated supporters. To maintain their engagement, consider reaching out with benefits and exclusive deals.
2. Visitor Metrics
Do you remember YouTubers showing their Subscribed-Not Subscribed ratios during their videos? This metric is somewhat similar in representing individuals who view your posts but aren't following your brand. There are three significant visitor metrics you should track:
- Page Views: The total number of visits your post or page received.
- Unique Visitors: The number of unique LinkedIn account holders who visit your post or page.
- Demographics of Visitors: The job roles, company sizes, industries, locations, and seniority levels of your visitors can inform your content strategy and unveil opportunities in emerging markets.
Employee Advocacy Metrics to Track
With employee advocacy metrics, you can monitor the following:
- Change in the number of recommendations
- Posts stemming from recommendations
- Reactions to employee posts
- Comments on employee posts
- Reposts
- Engagement rates of LinkedIn members
You can use these to comprehend the kind of engagement that employees are garnering.
LinkedIn Profile Metrics to Track
Good news for those without a LinkedIn business profile: you can still review some LinkedIn metrics, including your profile indicators. If you're leveraging the platform as a business influencer or to disseminate your opinions, thoughts, or articles, consider studying the following two metrics:
- Search Appearances: The frequency of your profile appearing in search results during a specified period.
- Post Views: These are the cumulative view counts accumulated by your posts, documents, or articles. You can delve into a post-by-post analysis to access insights such as reactions, comments, and share metrics.
How To Generate a LinkedIn Analytics Report on LinkedIn
An analytics report helps you get a bird's eye view of the efficacy of your entire social media marketing strategy. The reports you create showcase the major analytics categories that LinkedIn offers. Let's get a refresher on them by listing below the types of reports you can generate.
- Content reports
- Visitor reports
- Follower reports
- Lead reports
- Competitor reports
- Employee advocacy reports
Now, to create the actual reports, follow these easy steps:
- Step 1: Visit your LinkedIn page.
- Step 2: Click on the "Analytics" tab.
- Step 3: Proceed to the tab you wish to generate a report from, whether it's content, visitors, followers, leads, competitors, or employee advocacy.
- Step 4: Towards the top right corner of the screen, you will find an "Export" button.
- Step 5: Select the timeframe you want the report to encompass and then click the "Export" button.
And there you have it: a detailed report with all the info you need to access your marketing strategy on LinkedIn.
How Do Third-Party Tools Help With LinkedIn Analytics?
Accessing your LinkedIn analytics through its native platform is quite simple. However, there are ways to leverage the power of these analytics further. This is where third-party apps come in. A competent social media management service like Highperformr gives you an edge over your competition.
Highperformr not only helps you with LinkedIn but also allows you to integrate other social media accounts like X (Twitter) It makes cross-platform analysis a breeze. You can seamlessly manage, track, and compare metrics across multiple social accounts for your brand from a single platform.
Highperformr distinguishes itself with its advanced analytics and publishing features designed specifically for the social media platforms you are working with. It surpasses fundamental metrics by providing functions like "Growth Funnel Analysis" and "Content Topic Analysis" for effortlessly generating impactful posts.
The best part is that you can automate a lion's share of the repetitive tasks. Auto-posting not only boosts engagement but frees up valuable time so you can let your creative juices flow.
Sign up to Highperformr for free and enjoy unhindered business growth through social media.
